Few days back someone showed me a chart where he claimed that India almost outperforms China, claiming still does not know why are some investors so gungo about investing in China compared to India. I was smelling naive empiricism (using raw data not focusing on the generating process (distributions) to prove your points . I questioned him to change the time frames or size of windows its quite likely the effect won’t hold. He said even in 15 year rolling time frames the effect was holding?
Now there is some problem with this statement. But before going into the problem let’s look at the data ourself. So I used MSCI India and China indices gross price indices in USD. To make the comparison I took there rolling 15 year gross returns and Subtracted China from India, which means when China outperforms India we have Chart will be greater than 0 and vice-versa.

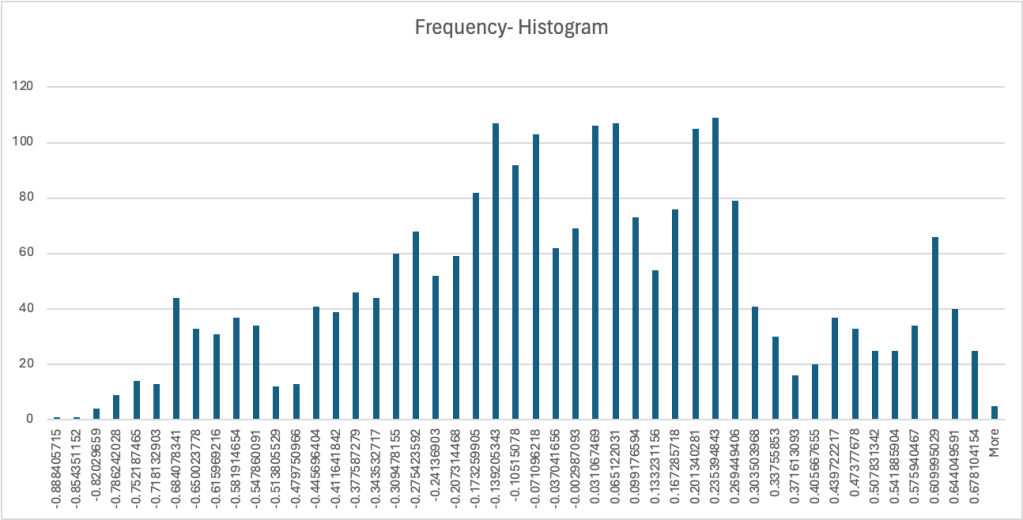
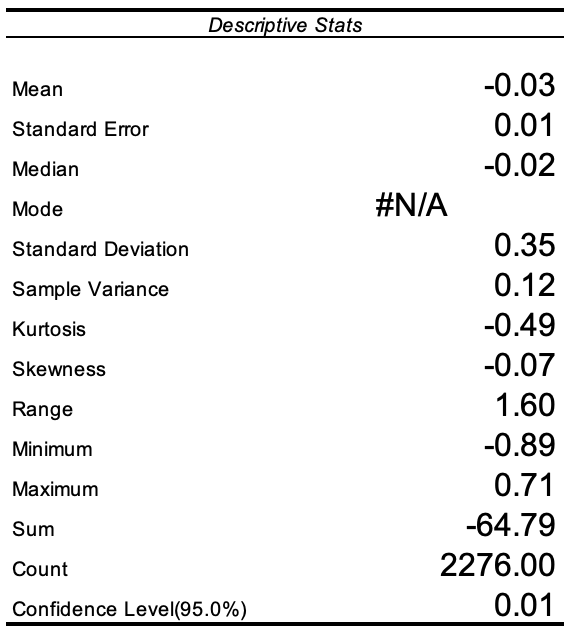
If we look at the distribution clearly the distribution is slightly negatively skewed, which means most of times China outperforms India by small amounts but when the opposite happens rarely, China underperforms massively. Now the problem with this is its the empirical distribution not the theoretical one. I won’t go into details but such analysis also not focusses on what we don’t have in data.
To be simple lets focus on the chart, sometimes its above zero (China outperforms India) while other times its below zero. While it particularly seems from 2017 to 2021 China outperformed India massively and then India took over, in terms of 15 years returns. Problem with this kind of analysis is – that if I remove a few points (Leverage – Tail points like 17 May 2004), the effect does not hold. What does it tell us? Even if we take rolling returns we can’t model regime changes (few high leverage points or fat tail events like 2008 falls have more value rather than rolling return taken within a 5year window). Its the few points which completely change whether India outperforms China or China outperforms India
Now the problem with the initial data presented to me by someone, is that it was cherry picked (Only some part of the Chart was focused)? Further, rolling returns do not capture Regime Changes (Naively). Market Regimes (Bull & Bear) change with few data points which are missing from data.
Next, time someone presents you with a 10 year chart think. While analysing charts like these it’s more important and beneficial to focus on what’s missing in the data not on what’s in the data. A process where few new datapoints change your assumptions, means your assumptions weren’t correct and markets are a risky place, far from what’s assumed. Further, Empirical Data to prove points is almost meaningless, there are high chances of being fooled by randomness.
